It is hard to figure out who are the largest players in shale oil, where they invest and what they do. Some have different investment and rolls in different locations. But for the sake of making this money making idea, I will try.
| Ticker | Bakkan | Marcellus | Utica | Niobrara | Haynesville | EF | Permian | Bakkan |
|---|---|---|---|---|---|---|---|---|
| EOG | — | — | — | — | — | — | Delaware, Bone Springs, Wolfcamp. | — |
| DVN | — | — | — | — | — | — | Delaware, Bone Springs, Wolfcamp. | — |
| CVX | — | — | — | — | — | — | — | — |
| XOM | — | — | — | — | — | — | — | — |
| HAL | — | — | — | — | — | — | — | — |
| COP | — | — | — | — | — | — | — | — |
| CLR | — | — | — | — | — | — | — | — |
| WLL | — | — | — | — | — | — | — | — |
| QEP | — | — | — | — | — | — | — | — |
| SSN | — | — | — | — | — | — | — | — |
| SLCA | — | — | — | — | — | — | — | — |
| GSFVG | — | — | — | — | — | — | — | — |
| SE | — | — | — | — | — | — | — | — |
Here is what we know:
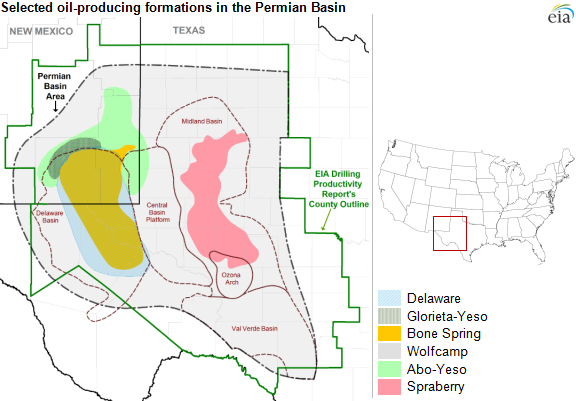
Texas is the nation’s largest oil producer (ref). The Permian is the largest oil field in Texas. It has several fields and formations.
The market has taken a leg down in May and in particular the energy stocks. ERY would have been a money maker but the volatility was just a bit too much, including the May 31 tweet. Nevertheless from the author of ref 5 there is a new article, JUST 10% OF SHALE OIL COMPANIES ARE CASH FLOW POSITIVE. This has been sited by other sources like Rigzone and Oil Price. Although the article does not specify the names of the companies, but it is not hard to figure that out. And if oil prices keep on sliding, then these will have to suffer further deterioration in the sense of shrinking margins as well. Below I am going to construct a table with some financials for some of these companies and identify some shorts.
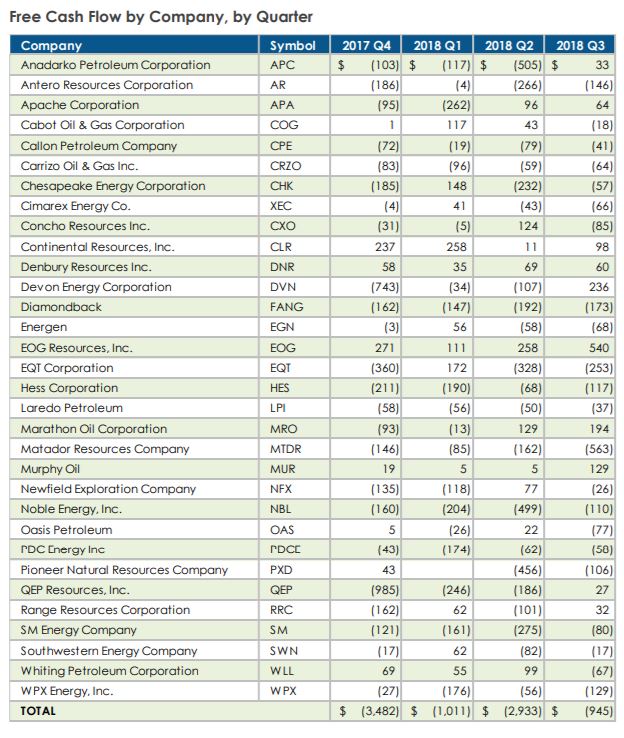
Let us take a look at the day MTDR. Their income has been declining and now negative, cash flow is negative, debt is 1.46B and the chart reflects all that. It is a great short but pay attention to the small cap, just shy from 2B. Also P/E is 9.64.
Next EQT, income positive but declining, cash flow barely positive 37 million, cash is 40 million and debt is 5.12 billion, cap is 4.68B and P/E is 25.77. The chart also shows that has been dying since 2014. So there might not be too much short in the this trade.
FANG, positive and decreasing net income (43 million), cash flow is -89 million, cash is 125 million, debt is 4.7 billion, cap is 16.15B and P/E is 17.20. The chart looks pretty good with a lot of air left in this company.
AR, something is wrong here. The total revenue for Q1 of 2019 is 1,114 million and the net income is 1,025 million. That is a stretch despite selling assets. Cash flow was 285 million for 2019-Q1. Cap is 2B and P/E is about 16. There total cash is zero and their debt is almost 7 billion. Over the last year the stock lost 70% of its value. Let us stay away from this stock.
HES, 2018 revenue was 6,152 million and Net Income of -115,000. In Q1 of 2019 rev were 1,533 mil and income was 75,000 mil. Cash flow for the same period were -394,000 mil. Cap is 16.95 Billion, and P/E 30.69. Cash is 2.3 B while the total debt is 7.65 B. So potentially they can buy some stocks back. The chart is dipping to 55 from almost 90 in the last year. I think we still have some ways to go down.
Refs:
1 – Maps: Oil and Gas Exploration, Resources, and Production
2 – The Biggest Texas Oil Fields Producing Today
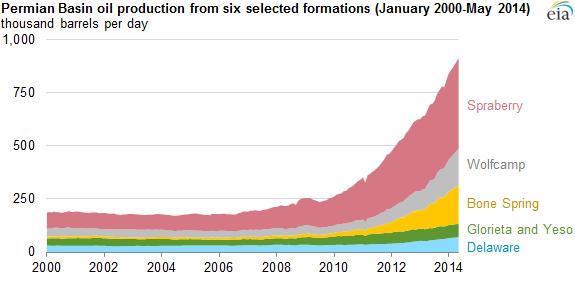
3 – Six formations are responsible for surge in Permian Basin crude oil production
4 – Fracking Companies on the Verge of Prosperity
5 – Shale companies struggle to please equity investors and reduce debt simultaneously
How to consider the cash flow, income and revenue!
Income statement vs cash flow statement
Cash Flow vs Net Income